

- Explain how the Six Forces model extends Porter’s Five Forces framework.
- Describe the six forces and the factors that make each one strong or weak.
- Identify the three types of entry barrier (exogenous, endogenous and ex-post).
- Apply the five-step method to a real industry example (crop-disease detection in Italy).
1. Introduction & objectives
The Porter Five Forces model, developed by Michael Porter and first published in the Harvard Business Review in 1979, is a strategic analysis tool used to understand the competitive forces that shape every industry. The model identifies five key forces that determine the intensity of competition and the potential profitability within a market. The Six Forces model expands on Porter’s framework by incorporating Grant’s sixth force: the bargaining power of complements (Grant, 2016; Brandenburger & Nalebuff, 1996).
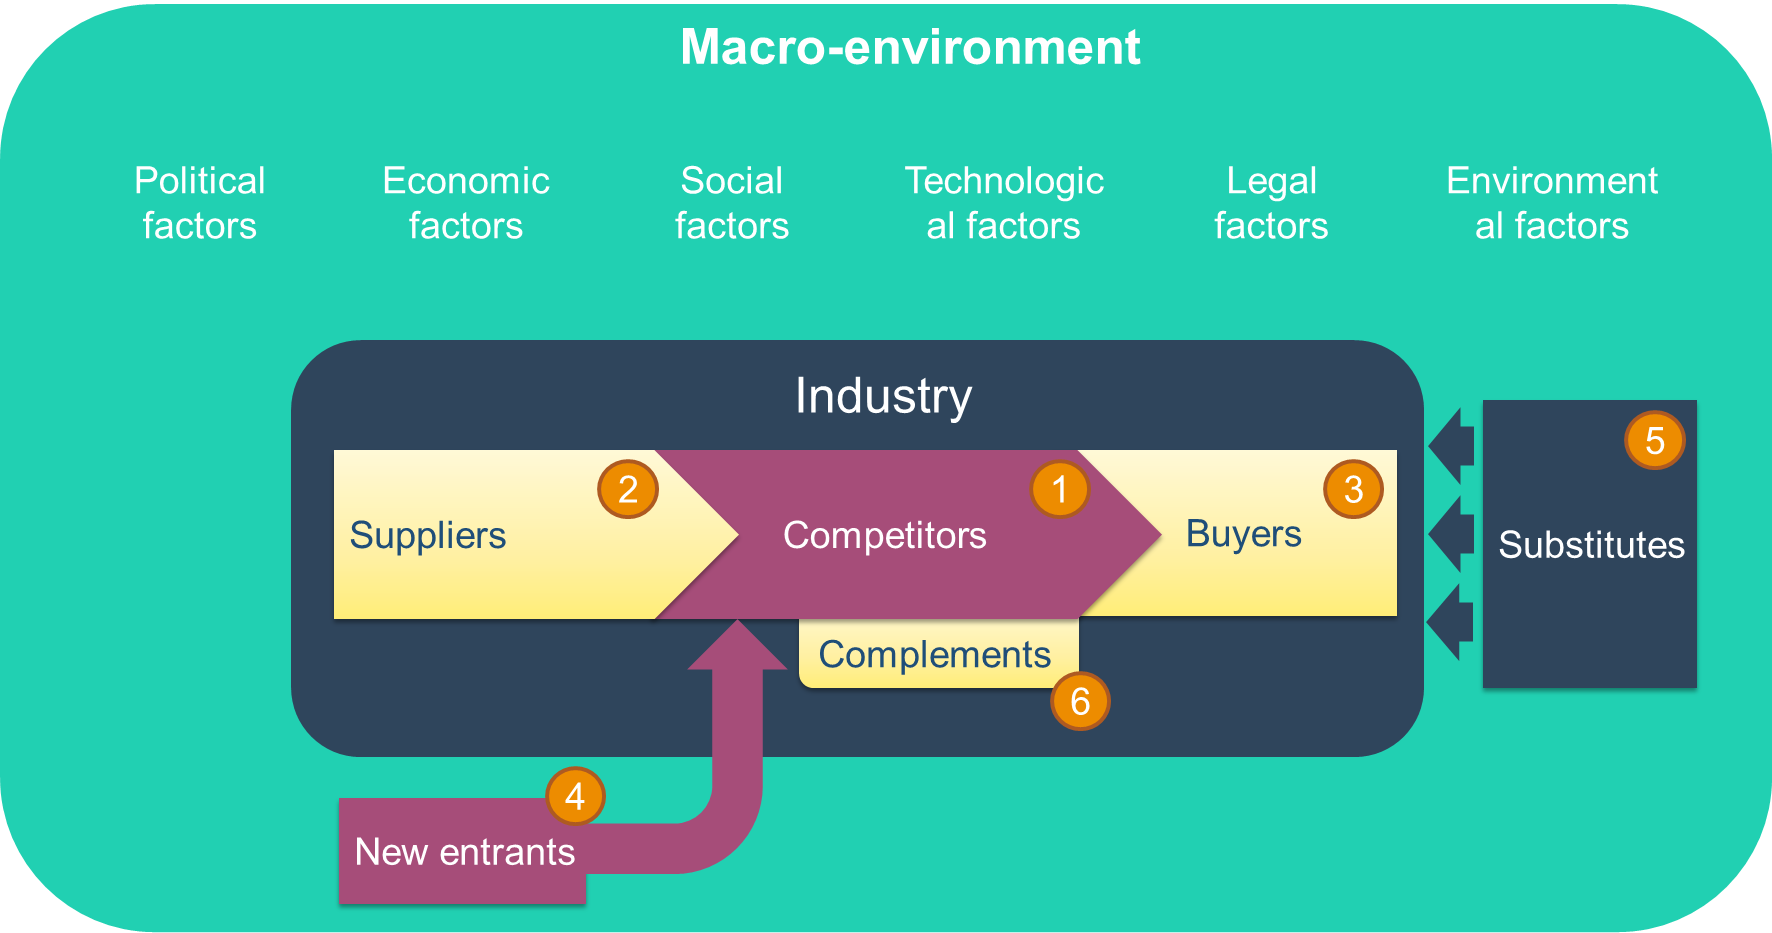
Suppliers, buyers, substitutes, new entrants and industry rivalry are the five original forces, each representing a different competitive pressure. Brandenburger and Grant added a sixth: the power of complements, which highlights products or services that make others more valuable. Together, the six forces help a business work out how to use or counter these pressures to gain an edge.
2. The parts of the tool: the six forces
Each of the six forces is rated as strong, medium or weak. As a rule of thumb, the stronger a force, the tougher the competition in that industry, and the harder it becomes for firms to stay profitable.
Force 1 · Rivalry among existing firms
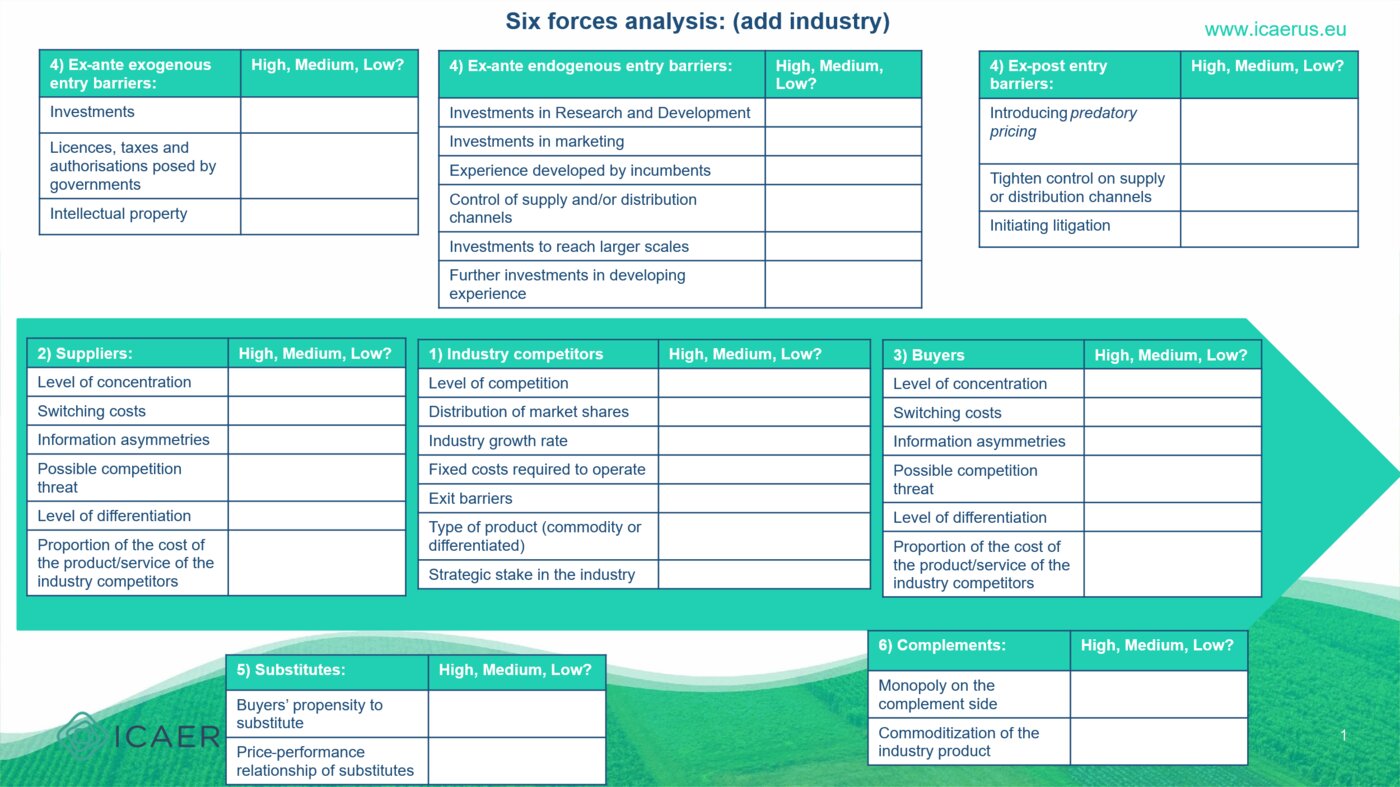
Influenced by: competitive industry type (monopoly/oligopoly reduce rivalry); how equally market shares are distributed; industry growth rate; high fixed costs; high exit barriers; whether the product is a commodity; and how high the strategic stake in the industry is for competitors.
Force 2 · Bargaining power of suppliers
Influenced by: how concentrated suppliers are; how high switching costs are; information asymmetries; whether suppliers pose a competition threat; whether suppliers offer a highly differentiated, hard-to-find product; and how large a share of total costs the supplier’s product represents.
Force 3 · Bargaining power of buyers
Influenced by: how concentrated buyers are; how low their switching costs are; information asymmetries; whether buyers pose a competition threat; whether buyers see the product as a commodity; and how price-sensitive buyers are.
Force 4 · Threat of new entrants
Industries are impacted by the threat of new entrants based on the presence of entry barriers, which can be exogenous, endogenous, or ex-post, as shown below.
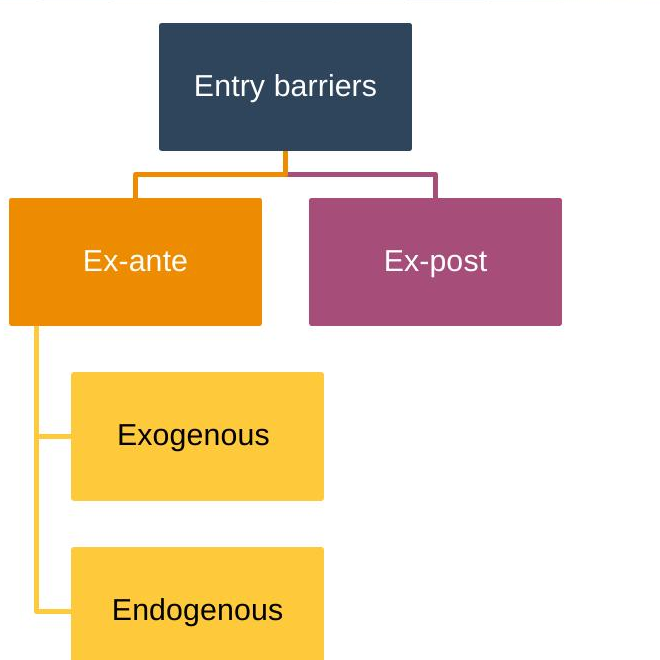
- Exogenous barriers: investments in fixed assets (plant, equipment); barriers posed by governments (licences, taxes, authorisations); legal barriers (copyrights, patents).
- Endogenous barriers: investments in R&D; investments in marketing to build customer loyalty; experience developed by incumbents; control of supply/distribution channels; further investment to reach larger scale or develop experience.
- Ex-post barriers: threats related to incumbents’ reputation for aggressive behaviour towards new entrants, such as predatory pricing, tightening control of channels, or initiating litigation.
Force 5 · Threat of substitutes
Substitutes limit an industry’s potential by capping the prices that can be charged. The threat is driven by customers’ propensity to substitute a product, and is higher when the price/performance ratio of the substitute is perceived as better. For example, drones are often favoured over helicopter rentals for aerial footage because they are more affordable and easier to use.
Force 6 · Bargaining power of complements
A product A is a complement of product B if an increase in sales of A generates an increase in sales of B: customers see product B as more valuable when it’s offered together with A. The organisation that sells the complement is the ‘complementor’. A software house selling mapping software for drones, for example, is a complementor of drone producers, because farmers see a drone as more valuable when it comes together with the mapping software. Complementors gain bargaining power when they create a monopoly over an essential complement (proprietary mapping software required by a drone, say), or lose it when the complement becomes an easily substitutable commodity (interchangeable drone cameras, for instance).
Data required
Being a qualitative analysis, the Six Forces Analysis benefits from combining multiple data sources, assessed for currency and reliability:
- Industry reports and publications (market research reports, trade journals)
- Government databases (economic/industry statistics, regulatory information)
- Company financial reports (annual reports, SEC filings)
- Market intelligence platforms (e.g. IBISWorld, Statista, MarketLine, Bloomberg)
- Academic research (scholarly articles, university publications)
- Interviews and surveys (expert interviews, customer surveys)
- Competitive intelligence (competitor websites, press releases, social media)
Method — five steps
- Step 1. Define the industry: which products/services are offered, and is competition local, national, regional or global?
- Step 2. Identify the forces operating in the industry and assess whether each is strong, medium or weak, and why.
- Step 3. Evaluate how the six forces influence the industry’s level of profitability.
- Step 4. Assess the general attractiveness of the industry to incumbents and potential entrants.
- Step 5. Evaluate possible changes in the six forces and how competitors, new entrants or the analysed company might influence them.
3. Example of application
A worked example was developed for the industry of crop-disease detection of plants in vineyards in the Italian market:
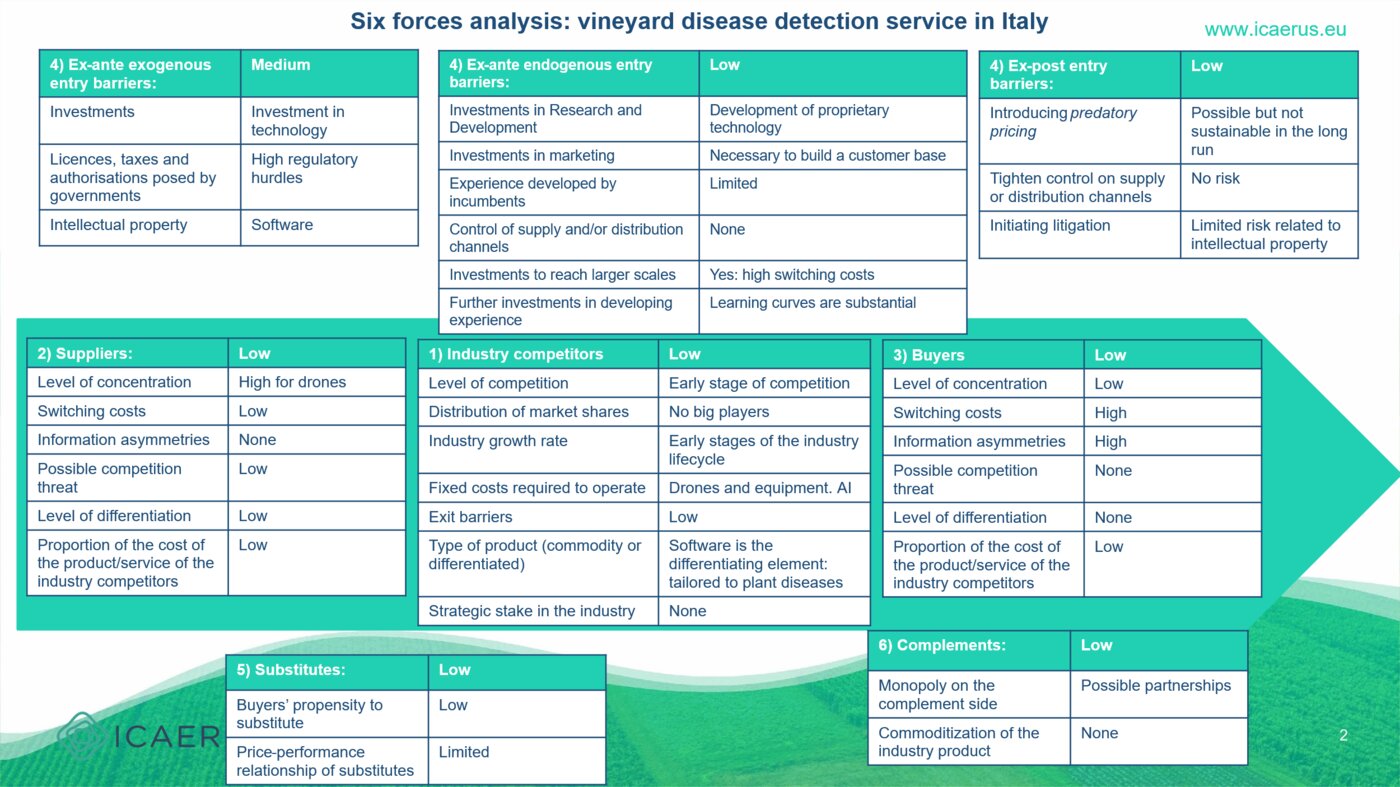
Industry rivalry: the competitive landscape for plant-disease detection services in Italy includes various players offering advanced diagnostic tools. The industry is growing due to increasing demand for precision agriculture and sustainable farming. Companies differentiate through technological advancement and specialised applications, making the market competitive but with room for innovation.
Bargaining power of suppliers: the industry relies on a limited number of suppliers for specialised components such as diagnostic kits and laboratory equipment. This concentration can increase supplier power, though switching costs relating to drone equipment are low.
Bargaining power of buyers: buyers span agriculture, horticulture and forestry, and are price-sensitive, especially in agriculture where cost efficiency is crucial. The availability of alternatives such as traditional scouting and visual inspection influences buyer power, although advanced diagnostics offer clear advantages in accuracy and precision.
Threat of new entrants: high regulatory hurdles and substantial capital requirements pose significant barriers to entry. Obtaining permits and complying with safety regulations is costly and time-consuming, and established companies’ reputations make it hard for new entrants to gain market share.
Threat of substitutes: traditional methods such as manual scouting and visual inspection can substitute for detection services. Advanced diagnostics offer advantages in accuracy, speed and precision, but switching involves costs related to training, equipment and integration.
Complementors: collaborations with research institutes enhance diagnostic capabilities and credibility. Partnerships offering molecular diagnostics and pest detection broaden the service offering, and working with agricultural universities provides access to cutting-edge research.
Which of the six forces is, in your view, the most significant threat to profitability for the vineyard/crop-disease detection service described above — and why?
References
Antitrust Division | Herfindahl-Hirschman Index. (2015, June 25). https://www.justice.gov/atr/herfindahl-hirschman-index
Besanko, D., Dranove, D., Shanley, M., & Schaefer, S. (2013). Economics of strategy (6th edition). Wiley.
Brandenburger, A., & Nalebuff, B. (1996). Co-opetition. Doubleday.
Grant, R. M. (2016). Contemporary strategy analysis: Text and cases (Ninth edition). Wiley.
Porter, M. E. (1979). How Competitive Forces Shape Strategy. Harvard Business Review, 57(2), 137–145.
Statista. (2024, June 28). Market share of leading drone vendors worldwide in 2023 [Graph]. Statista. https://www.statista.com/forecasts/1490315/market-share-drone-vendors-worldwide